Business Intelligence and Data Analytics Guide

Business intelligence (BI) is the set of technologies and processes that gathers scattered corporate data and turns it into meaningful, decision-ready insight. In short, it unifies reports, dashboards and analytics in one place to quickly answer “what happened, why did it happen, and what should we do next?” The numbers make the case clearly: the global business intelligence market grows from USD 44.94 billion in 2025 to USD 85.76 billion by 2030 (13.61% annual growth), and data-driven companies outperform competitors by 6% in profitability and 5% in productivity. This guide distills business intelligence and data analytics into a practical decision framework for leaders.
As Ankara-based Futurecode, we have built custom software and artificial intelligence solutions for more than 126 organizations. Our experience is clear: business intelligence is not a “nice-to-have reporting tool” but an operational capability that fuels growth.
What Is Business Intelligence?
Business intelligence is a framework that collects, cleans, connects and visualizes data from ERP, CRM, accounting, e-commerce and field systems. The goal is simple: let decision-makers find the right answer to the right question without drowning in spreadsheets. Traditional reporting tells you “what happened”; modern business intelligence adds the “why did it happen” and “what happens next” layers on top.
This is not a one-off project. As data sources grow, the BI foundation becomes embedded in the organization’s decision culture. In fact, self-service business intelligence adoption is rising 31% year over year — yet in most companies fewer than 10% of employees still work beyond spreadsheets. Closing that gap with the right tooling turns into a serious competitive advantage.
Types of Data Analytics
Data analytics sits at the heart of business intelligence and matures across four levels:
- Descriptive analytics: “What happened?” Summarizes historical data and reports core KPIs such as sales, inventory and collections.
- Diagnostic analytics: “Why did it happen?” Surfaces root causes — for example, why revenue dropped in a region, broken down by dimension.
- Predictive analytics: “What will happen?” Uses statistics and machine learning to forecast demand, churn or cash flow.
- Prescriptive analytics: “What should I do?” Recommends the best action, offering automated scenarios for pricing, routing or stock decisions.
Mature organizations use all four together. As you move from descriptive to prescriptive, business intelligence shifts from a “backward-looking report” to a “forward-guiding compass.”
From Data to Decision and Dashboards
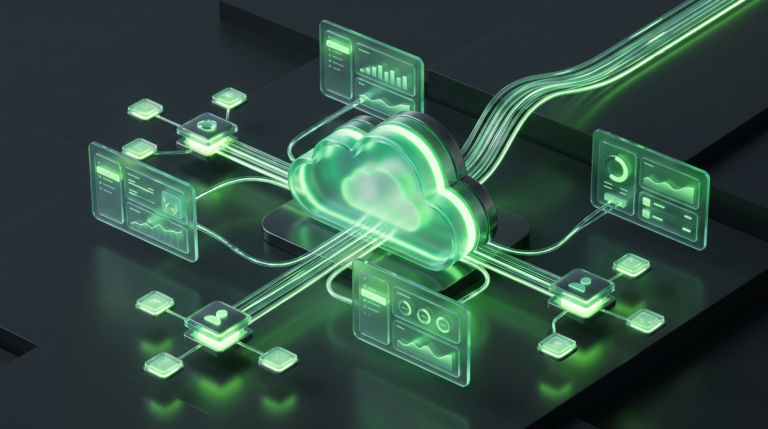
The value of business intelligence emerges in the journey that turns raw data into decisions. That journey has five steps: collect → clean → model → visualize → decide. Data from different systems is merged into a single model, then presented clearly to leaders through dashboards and reports.
A well-designed dashboard is role-based: the CEO sees profitability and cash flow, the operations manager sees delivery performance, and the sales team sees the pipeline — all from the same real-time source. The results are measurable: companies that use data tools for decisions are 58% more likely to hit revenue goals and 162% more likely to exceed them. This is the power of numbers: evidence decides, not intuition.
Business Intelligence and AI
Modern business intelligence is now intertwined with artificial intelligence. Asking in natural language “Who are my three most profitable customers this quarter?” and getting an instant answer; anomaly detection; automated summaries and forecasts — all come from the AI layer. According to McKinsey research, data-driven organizations outperform peers by up to 20%, and AI widens that gap further.
Futurecode’s AI solutions feed your business intelligence dashboards with prediction and recommendation engines, turning reports into a “decision assistant.” Your teams take action directly instead of merely interpreting data.
Setup and Tooling for SMEs
Business intelligence is not a privilege reserved for large enterprises. The right starting point for SMEs: define a handful of critical KPIs, establish a single trusted data source, and design simple role-based dashboards. Off-the-shelf tools enable a fast start, but as your business grows unique, standard solutions may fall short.
This is where custom software development comes in: a scalable BI foundation tailored to your processes that talks to your ERP and field systems. Loggerise, the platform we built for logistics companies, is this approach in action — converting operational data into instant decisions. Explore all our services to map out the right roadmap for your organization together.
Frequently Asked Questions
What is the difference between business intelligence and data analytics?
Data analytics is the set of methods for examining data and extracting insight; business intelligence is the broader framework that integrates that analytics into decision processes through collection, reporting and dashboards.
When should a small business start with business intelligence?
The moment spreadsheets slow your decisions and data stays scattered. Starting with a small pilot around a few KPIs is the healthiest path.
How quickly does a BI project deliver results?
It depends on scope; a well-defined pilot dashboard usually delivers first insights within a few weeks, while maturity is continuous.
Should I choose an off-the-shelf BI tool or custom software?
Off-the-shelf tools are fast for standard needs; but if your processes are unique and you aim for a competitive edge, custom software is more flexible and scalable.
Decide With Data
Business intelligence transforms an organization run on intuition into one run on evidence. From Ankara to businesses across Türkiye, the Futurecode team builds the foundation that turns your data into competitive strength. To discuss your project, get in touch with us and start your data-driven transformation. For the international context, you can also review McKinsey QuantumBlack insights.